Satellite SST vs In-Situ Temperature 衛星海水温 vs 実測水温
How accurately do satellites measure sea surface temperature? We compared NASA satellite data with temperature loggers installed at 44 coral reef sites across Japan — and found remarkably close agreement. 衛星から測った海水温は、実際に潜って測った温度とどれくらい一致するのでしょうか? 環境省モニ1000の水温ロガーデータ(44地点)とNASA衛星データを比較検証しました。結果は、驚くほど高い一致を示しています。
What We Compared 検証したデータ
Satellite SST 衛星SST
NASA MUR SST
- 1km resolution, daily1km解像度、日次
- Surface skin temperature (~1mm)海面皮膚温(~1mm)
In-Situ Temperature 実測水温
Moni1000 Loggersモニ1000ロガー
- 44 sites, 21 regions44地点、21サイト
- Water depth: ~5m水深: 約5m
- Period: 2019-09 to 2025-01期間: 2019年9月〜2025年1月
Correlation Plot 相関図
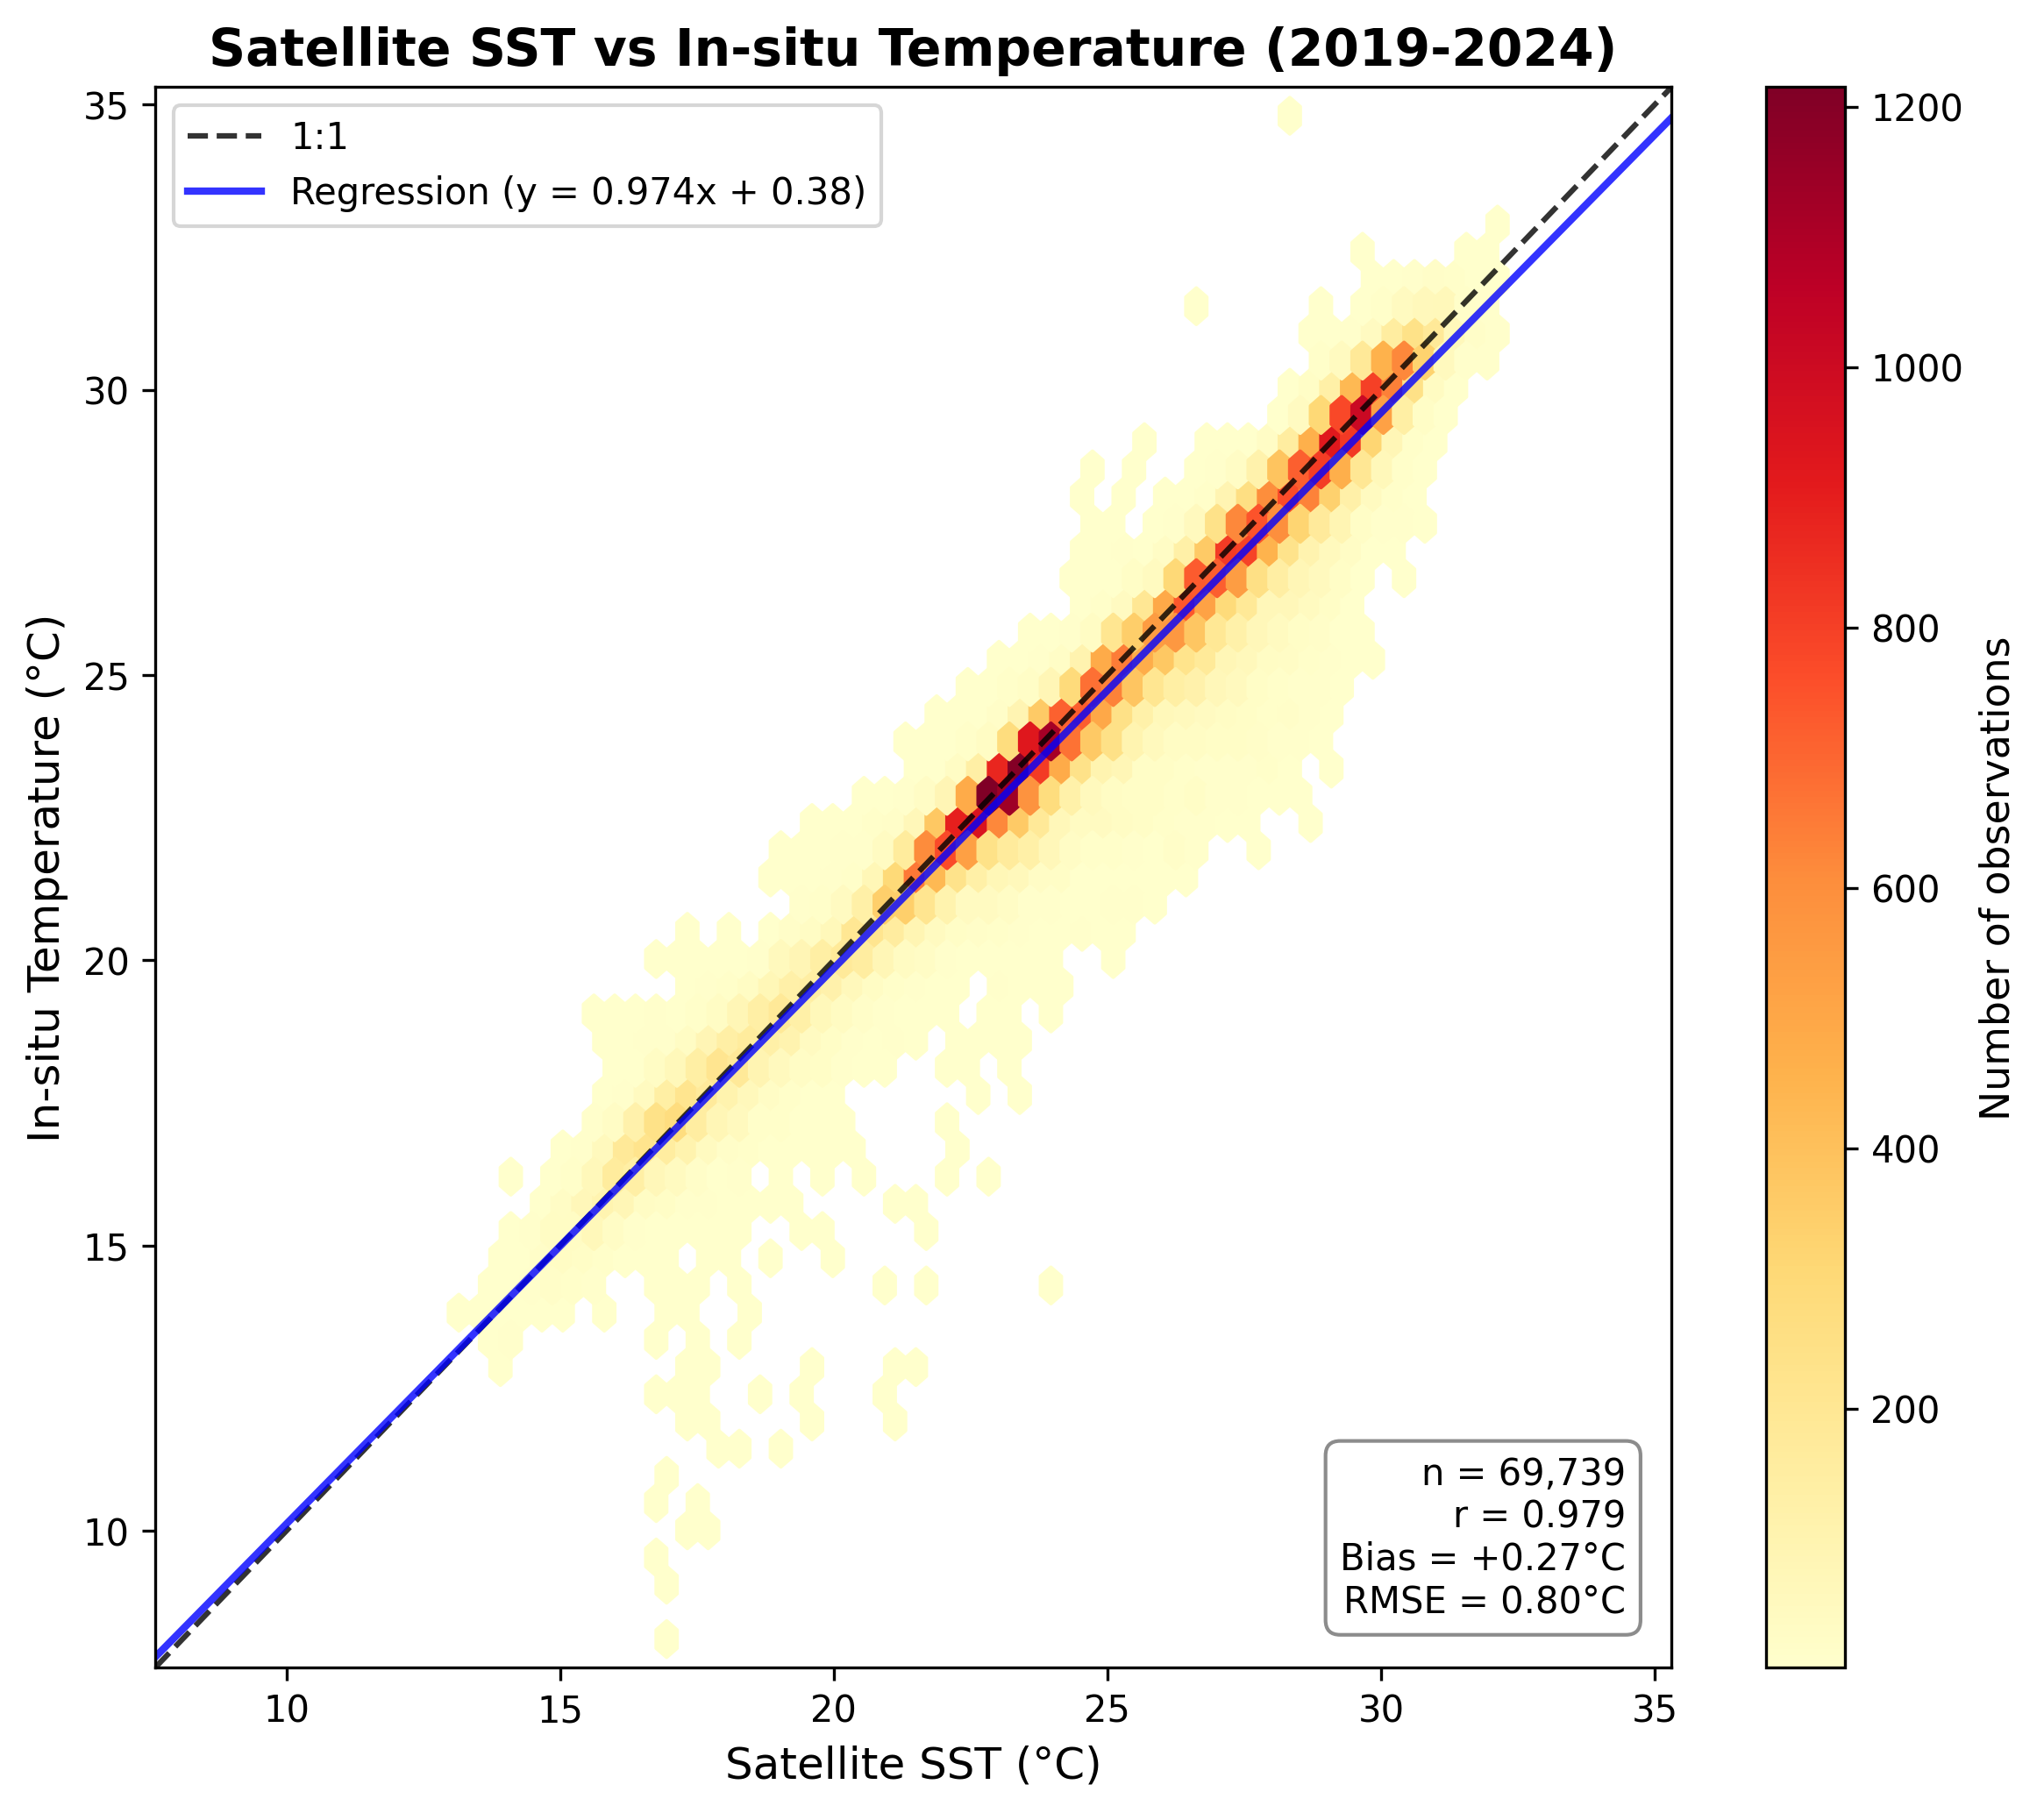

Hexbin density plot showing satellite SST vs. in-situ temperature (n=69,739). The red dashed line indicates perfect agreement (1:1). The color intensity represents data density. 衛星SSTと実測水温の密度プロット(n=69,739)。赤破線は完全一致(1:1)を示す。色の濃さはデータ密度を表す。
Logger Locations ロガー設置地点
44 temperature logger sites from Moni1000 survey. Color indicates regional grouping. Click markers for site details. モニ1000調査の水温ロガー設置44地点。色は地域区分を示す。マーカーをクリックで詳細表示。
Regional Differences 地域による違い
The relationship between satellite and in-situ measurements varies by region. A slope of 1.0 means perfect tracking — when the satellite reads 1°C higher, the actual water temperature is also 1°C higher. Lower slopes mean satellites overestimate warming at high temperatures; higher slopes mean the opposite.
衛星と実測の関係は、地域によって異なることがわかりました。傾き1.0は完全な追従を意味します——衛星が1℃高いとき、実際の水温も1℃高い。傾きが1.0より低いと、衛星は高温時に温度を過大評価する傾向があり、1.0より高いとその逆です。
Honshu & Remote Islands 本州・外洋離島
→ Satellites tend to overestimate high temperatures by about 1°C → 高温時に衛星は約1℃高く見積もる傾向
13 sites: Tateyama, Kushimoto, Shikoku, Amakusa, Yakushima, Iki-Tsushima, Ogasawara 13地点: 館山、串本、四国、天草、屋久島、壱岐対馬、小笠原
Okinawa Main Island Area 沖縄本島周辺
→ Satellite values can be used as a reliable reference → 衛星の値をそのまま参考にできる
10 sites: Amami, Onna, Higashi, Kerama, Minna 10地点: 奄美、恩納、東村、慶良間、水納島
Sakishima Islands 先島諸島
→ Satellites track actual temperatures very closely → 衛星と実測がほぼ一致
21 sites: Miyako, Yaeyama, Ishigaki, Iriomote 21地点: 宮古、八重干瀬、石垣、西表

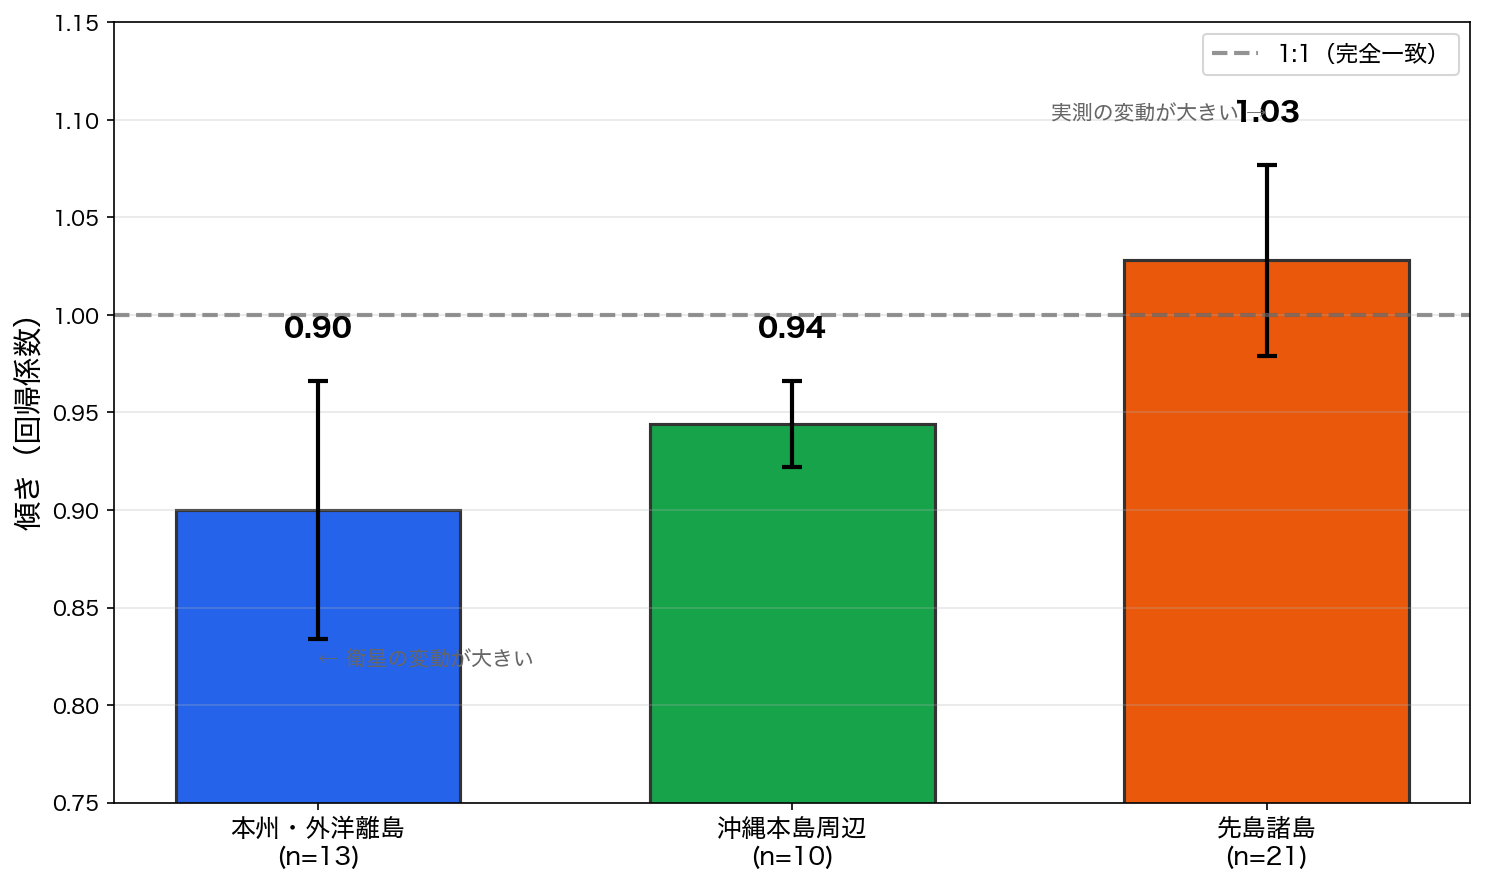
Regression slopes by site with 95% confidence intervals. Dashed line at 1.0 indicates perfect agreement. 地点別の回帰傾き(95%信頼区間付き)。破線(1.0)は完全一致を示す。
Why Differences Occur なぜ違いが生じるのか


Satellite Measurement
衛星の測定
Satellites measure the "skin temperature" of the ocean surface — the topmost ~1mm layer. This layer heats up quickly under direct sunlight.
衛星は海面の「皮膚温度」(最上層~1mm)を測定します。この層は日光で急速に温まります。
Logger Measurement
ロガーの測定
Temperature loggers are installed at ~5m depth on the reef. This water is mixed by currents and waves, averaging out the daytime heating effect.
水温ロガーはサンゴ礁の水深約5mに設置されます。この深さでは海流や波で混合が進み、日中の加熱効果が平均化されます。
Regional Patterns
地域パターン
In shallow bays (Honshu), surface heating is pronounced → satellite reads higher. In open oceanic waters (Sakishima), vertical mixing is stronger → satellite and logger agree better.
本州の内湾では表層加熱が顕著で、衛星が高めに出ます。先島諸島のような外洋的環境では鉛直混合が強く、衛星とロガーがより一致します。
What This Means for DHW DHWへの含意
Satellite-derived DHW remains a reliable indicator of thermal stress. The +0.27°C bias means satellite DHW values may be slightly elevated compared to what corals experience at depth, but the very high correlation (r = 0.98) confirms that satellite data accurately tracks temperature trends and anomalies.
衛星由来のDHWは熱ストレスの信頼できる指標です。+0.27℃のバイアスは、衛星DHWがサンゴの生息深度よりやや高めに出る可能性を示しますが、非常に高い相関(r = 0.98)は、衛星データが温度トレンドと異常を正確に追跡していることを確認しています。
For practical coral reef monitoring, satellite SST provides excellent coverage and temporal resolution. Field observations remain essential for ground-truthing and understanding local conditions that satellites cannot detect.
実用的なサンゴ礁モニタリングにおいて、衛星SSTは優れた空間カバレッジと時間分解能を提供します。現場観察は、衛星では検出できない局所的な状況を理解するための検証として依然として重要です。
Limitations and Caveats 限界と留意点
The high correlation (r = 0.98) supports the continued use of satellite-derived indices for broad-scale thermal stress monitoring. However, three limitations should inform interpretation:
衛星と実測の高い相関(r = 0.98)は、広域的な熱ストレスモニタリングにおける衛星由来指標の有用性を支持します。ただし、解釈にあたっては以下の3点を考慮する必要があります。
1. Systematic Positive Bias 1. 系統的な正のバイアス
The +0.27°C mean bias reflects the inherent difference between skin temperature (~1mm) and sub-surface conditions (~5m). This bias varies with solar radiation and wind speed, reaching its maximum under calm, sunny conditions. Over a 12-week DHW accumulation period, this could translate to 1–2 DHW units of uncertainty.
+0.27℃の平均バイアスは、皮膚温(〜1mm)と水中環境(〜5m)の本質的な差異を反映しています。この差は日射や風速によって変動し、穏やかな晴天時に最大となります。12週間のDHW累積期間では、1〜2 DHW単位の不確実性に相当しうる値です。
2. Regional Heterogeneity 2. 地域間の異質性
Regression slopes varied from 0.81 (Ogasawara) to 1.10 (eastern Ishigaki), with a coefficient of variation of 7.75%. This means:
回帰傾きは0.81(小笠原)から1.10(石垣東部)まで変動し、変動係数は7.75%でした。これは以下を意味します:
- Honshu & remote islands (slope ~0.90): Satellite DHW may overestimate thermal stress by up to 10% 本州・離島(傾き〜0.90): 衛星DHWは熱ストレスを最大10%過大評価する可能性
- Sakishima Islands (slope ~1.05): Satellite DHW may underestimate thermal stress by up to 5–10% 先島諸島(傾き〜1.05): 衛星DHWは熱ストレスを5〜10%過小評価する可能性
A uniform correction factor cannot fully capture this geographic variation.
単一の補正係数では、この地理的変動を完全には捉えられません。
3. Temporal Smoothing 3. 時間的平滑化
Daily satellite composites average out sub-daily thermal extremes. Brief but intense heat spikes — which may be physiologically significant for corals — are not captured in the satellite record.
日次の衛星コンポジットは、日内の極端な温度変動を平均化します。サンゴにとって生理学的に重要かもしれない、短時間だが強烈な熱スパイクは、衛星記録には反映されません。
Despite these limitations, satellite SST remains the only practical tool for monitoring thermal stress across the 500+ reef sites where in-situ data are unavailable.
これらの限界にもかかわらず、衛星SSTは、実測データが存在しない500以上のサンゴ礁地点で熱ストレスを監視するための唯一の実用的手段であり続けます。
What Satellite SST Can and Cannot Do 衛星SSTで「できること」と「できないこと」
✓ Reliable For ✓ 信頼できる用途
- Tracking temperature trends over time経時的な温度トレンドの追跡
- Broad-scale regional monitoring広域的な地域モニタリング
- Relative thermal stress comparison相対的な熱ストレス比較
- Early warning of bleaching risk白化リスクの早期警告
- Long-term climate trend analysis長期的な気候トレンド分析
⚠ Use With Caution ⚠ 注意が必要な用途
- Precise absolute temperature estimates絶対温度の精密推定(バイアス +0.27℃)
- Direct comparison across distant regions離れた地域間の直接比較(傾き 0.81〜1.10)
- Proxy for temperature at coral depthサンゴ生息深度の温度の代替
- Detecting sub-daily thermal extremes日内の極端温度イベントの検出
- Site-specific bleaching threshold prediction地点固有の白化閾値予測
Technical Details 技術的詳細
Linear Regression (Overall)
線形回帰(全体)
In-situ = 0.974 × Satellite SST + 0.38
R² = 0.958
Mixed Effects Model
混合効果モデル
We used a random slopes model to account for site-level variation:
地点間のばらつきを考慮するため、ランダム傾きモデルを使用:
In-situ ~ Satellite + (Satellite | Site)
- Fixed slope: 0.971固定傾き: 0.971
- Random slope SD: 0.075ランダム傾きSD: 0.075
- Coefficient of variation: 7.75%変動係数: 7.75%
Heterogeneity Test
異質性検定
- Cochran's Q = 2429.7 (p < 0.0001)
- I² = 98.2%
High I² reflects the large sample size (69,739 pairs), which detects even small differences as statistically significant. The actual correlation range across sites is narrow (0.945–0.991).
高いI²は大きなサンプルサイズ(69,739ペア)を反映しており、わずかな差も統計的に有意として検出されます。実際の相関係数の範囲は狭い(0.945–0.991)です。
Data Sources データ出典
- In-situ temperature:実測水温: Ministry of the Environment, Monitoring Sites 1000 Coral Reef Survey (2020-2024) 環境省モニタリングサイト1000サンゴ礁調査(2020〜2024年度)
- Satellite SST:衛星SST: NASA MUR SST v4.1